Stocks Inching Toward Major Support Levels
All signs point to a rough couple days ahead; keep your eye out for a bounce.
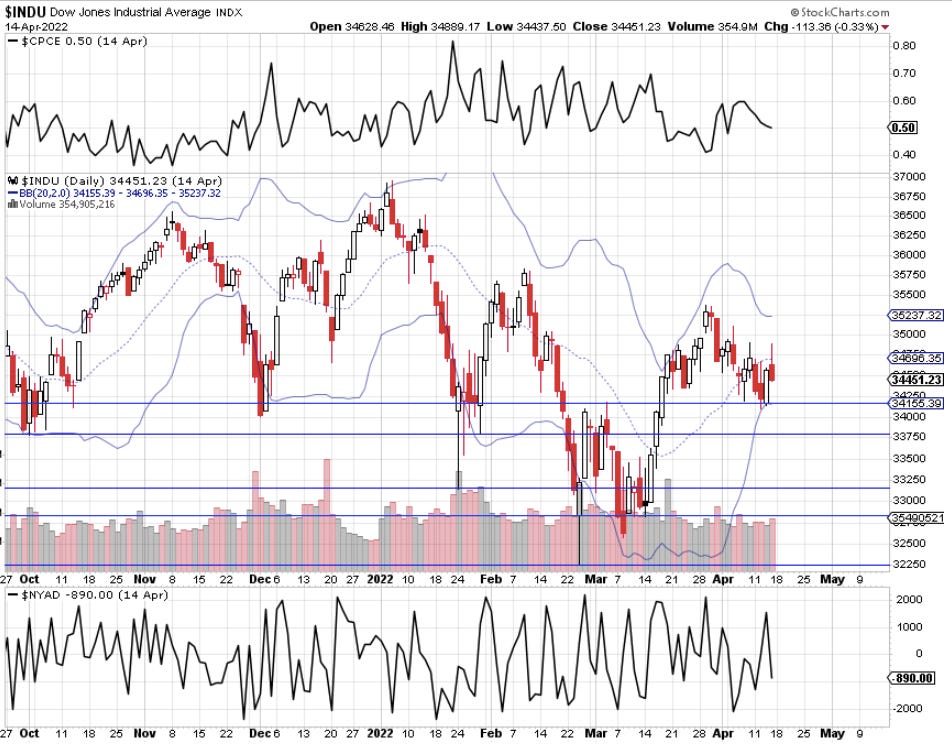
Thursday we saw an intraday reversal on the Dow, and bearish engulfing patterns on both the S&P 500 and Nasdaq.
These are generally very bearish signals that are obvious to bulls and bears, and have a powerful affect on short-term price action.
The outlook for the next few days is negative, and futures in Asia are confirming the price action as I type this.
But don’t lose hope - despite the fundamental news, the technicals signal we’re in for a massive bounce. At the end of this post I tell you how to identify that bounce if it does come along.
Let’s dive in.
Stocks Had a Nasty Pullback Thursday
Here is the Dow reversal from Thursday the 14th:
The Dow intraday reversal, known as a Shooting Star among the Japanese, happened at the 20-period simple moving average. Many traders follow moving averages, so this strengthens the candle signal.
Here is the S&P, which formed a Bearish Engulfing — generally a very bearish signal given the psychological implications.
Recall that these price patterns have profoundly psychological affects that effect price in the very short-term.
Psychological Impact of Japanese Candlesticks
Here is the psychological of the price patterns we happened to see Thursday. They happen all the time, but here I am drilling down on two of them.
Intraday Reversals: price rallies in a session, only to reverse and close negative for the period. This sends a huge warning signal to bulls second guessing their positions (especially new bulls). Bears of course know this and look for such signals, pouncing when they see it.
Bearish Engulfing: price rallies in the day before, gaps open on the current session, and then sells off all day into the close, closing below the day before. Again, like intraday reversals, this sends a major warning signal to the bulls, immediately second guessing their positions.
NASDAQ confirmed Dow and S&P price action with a bearish engulfing as well.
Quick Stockcharts.com Primer
Head over to Stockcharts.com and type in $INDU for Dow, $SPX for S&P, and $COMPQ for the Nasdaq.
Below the chart, where it says Simple Moving Average, change that to Bollinger Bands. Remove the other Simple Moving Average (choose None), and hit update. Check this everyday at 3:45pm, just before the close.
Becoming extremely familiar with candlestick reversal patterns will help you identify short-term sentiment and price swings in the market.
Click the links in the below section to learn about the 3 major reversal patterns I look for, especially at Bollinger.
Price Levels to Watch for a Bounce
Dow Jones
On the Dow, pay close attention to the following support levels in the coming days/weeks.
34,155 (Lower Bollinger)
33,000-34,000 (multiple support levels)
Look for a piercing pattern, intraday reversal, or Bullish Engulfing at these levels:
The S&P 500
4,373 (Lower Bollinger)
4,150-4,350 (multiple support levels)
Look for a piercing pattern, intraday reversal, or Bullish Engulfing at these levels:
What I’m Looking For This Week
I personally think a hard bounce happens. We are in a midterm election year AND the candlesticks on the monthly charts are very bullish for stocks:
The last three months, we’ve seen long lower shadows. At this point, given where price is hovering, it’s only reasonable to think bulls will step in hard at these levels.
Final Thoughts
I know inflation and the Ukraine-Russia war is weighing heavily on stocks, but the market looks like it’s going to slingshot higher.
If the historical data on the midterm elections is any indication, we’re in for a nice ride higher.
Happy Trading 😊
P.S. Did you notice on the last chart that 4,150 is the 20-month moving average for the S&P? In the chart before it, 4,150 is right in the hot zone for a bounce. This ultimately strengthens the area as a support level, because more traders have their eye on it: many traders will buy when price hits the 20-month moving average, and many will buy when they see it approach that level as purely a support zone. This is why I expect a violent bounce this week or next.


