
✅ Time Stocks With Two Simple, Powerful Tools
Combine price action with Fibonacci for high probability trade set-ups.

My #1 goal of this newsletter is to provide you with real-time examples to learn how to trade. My goal is not to make recommendations or stock picks. It’s simply to tell you what I’m looking at, and what I see. And I put it out there so I can’t be dishonest with myself about what I’m saying. In other words, this newsletter holds me incredibly accountable in my own trading and investing (more on this later).
Thanks again to my 500+ subscribers. I show up to do this for you…
Anyway - let’s dive into today’s real-life learning opportunity. The stock market is at a major pivotal level. I say this because there is a “confluence” of signals suggesting a sell-off is underway.
Stocks are at a very significant, pivotal level.
Last week we saw an intra-week reversal, where stocks rallied higher, only to close lower on the week. This price action has deeply profound psychological indications on new bulls who enter the market; and it spooks them into liquidating a volatile position.
But what’s more significant, is the intra-week reversal happened at a confluence of resistance levels:
The January, 2022 low, and also the
The February, 2022 low, and also the
The March, 2022 low, and also the
The 50% reversal of 2022’s entire price range (January high to June low), and not to mention,
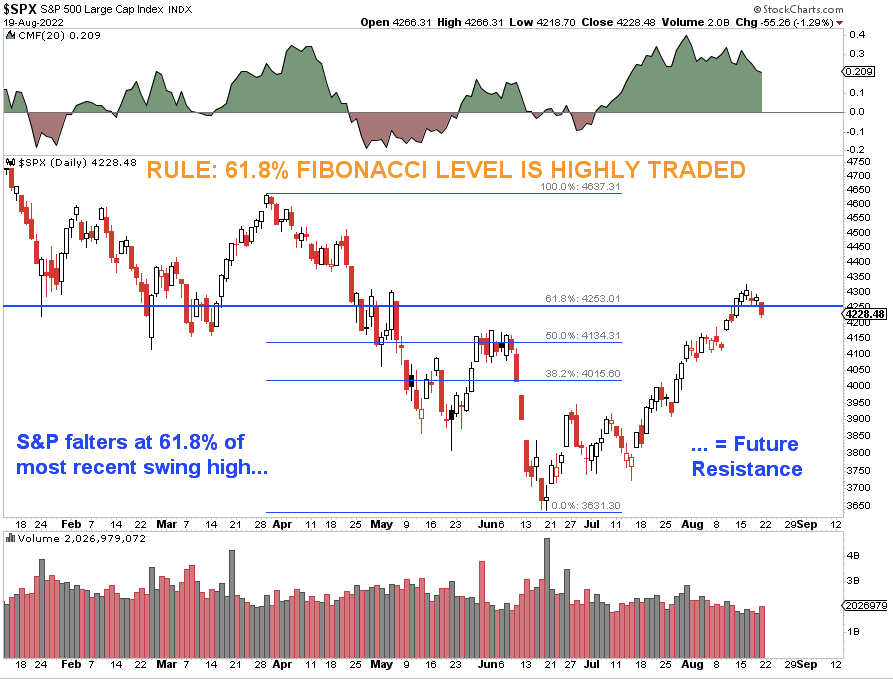
The 61.8% reversal of the most recent 2022 swing high (March high to June low, i.e. these levels are Fibonacci levels)
See how it all lines up? No? Well then, check out the charts below to learn how to use price action + Fibonacci to time the market. These are two of the most powerful tools to use in price/technical analysis. Le't’s dive in…
Here are the charts for you to see…
Chart 1: Prior Support = Future Resistance (and the longer the time frame, the more powerful the signal). S&P Weekly Chart.
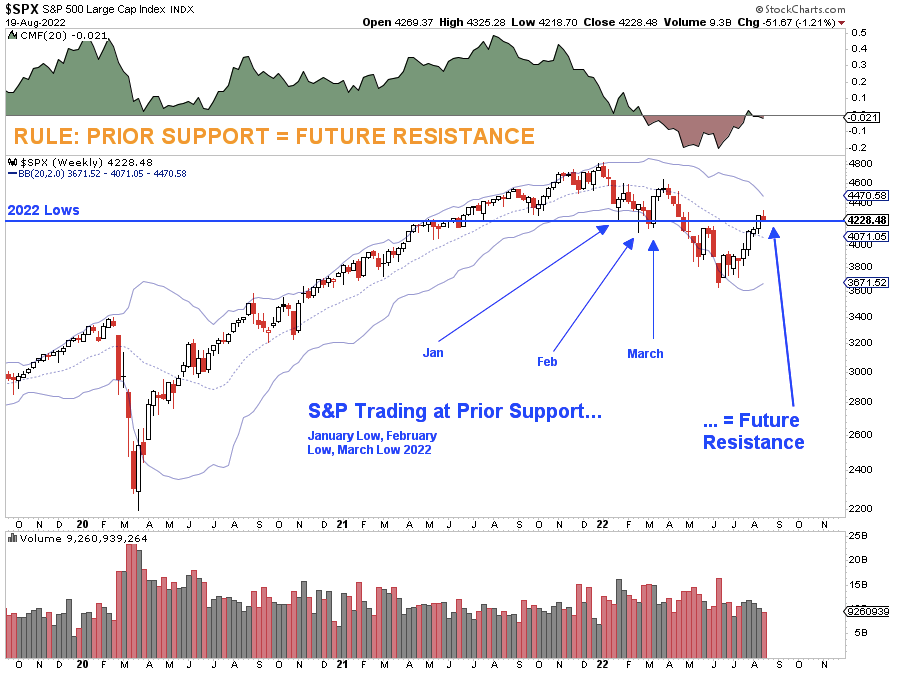
Chart 2: S&P recoups 50% of losses for 2022 (Fibonacci 50% retracement). S&P Weekly chart.
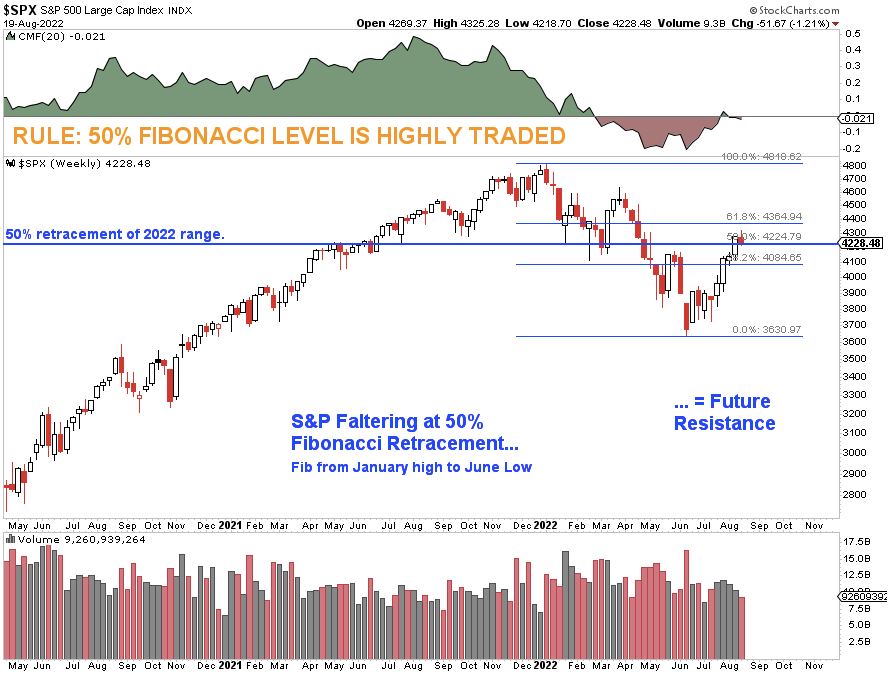
Chart 3: S&P recoups 62% of the losses from March high to June low.
A confluence of price signals suggest a sell-off is now underway.
As you can see, price is at the same level when viewed through several different time frames and methods. This creates confluence: Many traders who trade support and resistance (1-3 levels) or Fibonacci (4-5), will all act on their signals. It looks like a sell-off is underway*.
Confluence is the natural conversion of things. As these signals all converge around S&P 4,250, price begins to manifest itself…
Where do stocks go from here?
You can expect the market to sell off. We know with a high probability it will; the question then becomes, is the sell off a relief to the new bull market, or a new leg lower past the June lows?
How low will stocks go? Read this.
*I had to qualify this statement. It definitely looks like a sell off is eminent, and yes the question becomes, is it a new leg lower or a pullback? I personally believe it’s a pull back given the insane money flow entering stocks. That said, however… any real sell-off will need bad news to accelerate it. If the market sells off without very bad news, it’s likely a breather before a new leg higher (again, considering the money flows). I will be looking to buy any candlestick signal on a pullback, especially if it’s at Bollinger or another Fibonacci level.