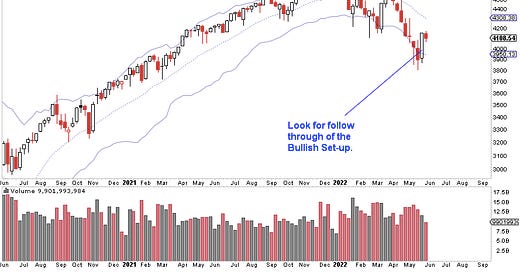
The tools I teach here successfully identified stock market “bottoms” of late January, late February, the pump fake in early May, and the bottom from two weeks ago.
The big question remains, will the stock market rally last?
I want to see follow through this week. Last week bulls faltered. Bears faltered. There was lots of indecision. That generally means there is a change in trend.
As I write this, pre-market is up big.
S&P 500, Weekly:
All Eyes on S&P Levels: 4,200 - 4,300
Remember, we have support and resistance zones on financial markets. These are areas where price bounces off the floor (support), or ceiling (resistance), as traders take profit or enter positions.
Support/resistance make for great trading opportunities.
This week, I’m looking for a rally to these levels (red lines) along with any candlestick reversals.
S&P 500, 4-hour:
Intro to Fibonacci
Notice where it says “38.2% Fib”, “50% Fib”, etc.?
Today or tomorrow, I’ll be dropping an entire video about what that means: Fibonacci and the Golden Ratio. Fibonacci and the Golden Ratio are found in every aspect of nature, including financial markets.
Price tends to act erratically at Fib levels, and that makes for great trading opportunities.
When Fib levels and prior support / resistance levels line-up, that is called confluence, and it makes for an even higher probability trade set-up.
If I see a candlestick reversal at one of these resistance levels, I will take the trade on the short side, albeit a very quick trade, since the trend is up.
Happy Trading 😊


