Use this tool to fade other investors.
At-home investors hit most bearish level since March, 2009.
The American Association of Individual Investors, or AAII, puts out a “sentiment” survey every week about how investors are feeling.
The survey asks whether AAII members are bullish, bearish or neutral.
AAII Members include:
At home / “retail” investors
Non-institutional investors
In other words, the AAII represents the “investing public”.
Historically, when survey members report being overly bearish or bullish, the market tends to reverse in the opposite direction (even if just temporary).
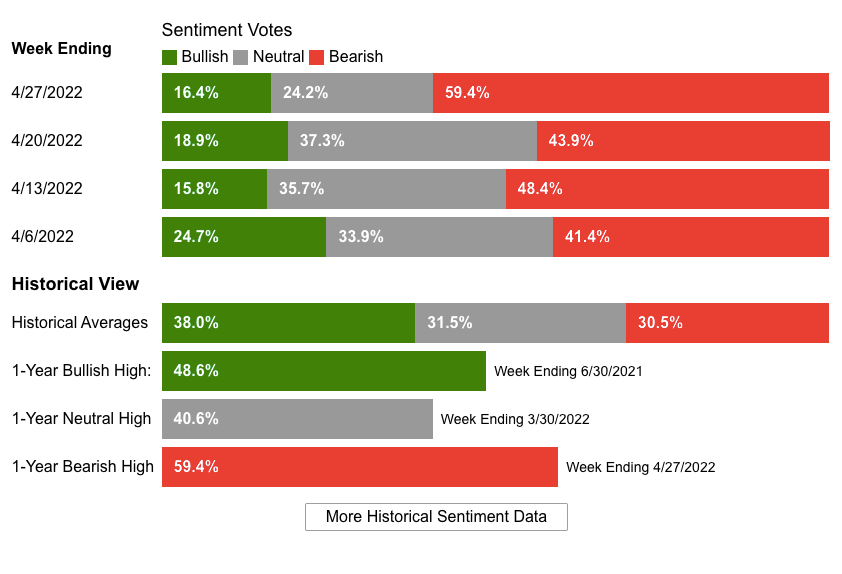
The week ended April 27th, bearish sentiment hit a 12-month high at 59.4%.

In fact, I was so curious, I downloaded their historical data and found that…
The 59.4% reading last week was higher than ANY reading in 2020.
Also the highest reading since March 5th, 2009, which had a reading of 70% “bearishness” - the market bottomed March 9th, 2009…
The last time the survey hit a 12-month bearish high was the week ending January 26th, at 59.2%. The market bottomed the week after, and rallied the following week after that. Another big reading was clocked end of February, again, leading to a market rally. Yellow = recent readings over 50% = market rallies.
The herd is usually late to the game.
The following week after January 26th very bearish reading, we saw a violent bounce. After the March 5th, 2009 reading, we saw a bull market that lasted until recently.
At-home investors are usually late to the game. This tool can help you fade them.
The bearish reading on the AAII sentiment survey lines up with a peak in the put/call ratio and divergence in A/D line.
This sentiment survey is by no means an end-all-be-all indicator. But it’s anecdotal evidence can be helpful. Remember, trading requires a mosaic approach to be successful. My goal is to bring the tools to your attention.
Happy Trading 😊


