


The Market is Selling Off. Now What?
Here's what I'm looking this week, in light of all the headlines.

There’s lots of rumors about what’s happening with Russia/Ukraine and the Fed rate hike. All I can say is that the bias is down, and in a down market, sell the rumor and buy the news.
Read on to learn exactly what I am looking at this week…
Quick Overview of Price: Bulls on Struggle Bus
The price action over the last three week signals bulls are running out of steam. Every rally since January 24th has seen almost immediate selling.
Last week’s price action confirmed the bearish price action, with two intra-week reversals in a row:

Until we see a signal that confirms a “bottom”, the bias remains to the downside.
Keep Your Eye Out for S&P ~4300
The S&P weekly chart looks like price is about to have a major day of reckoning with the 4,300 level:
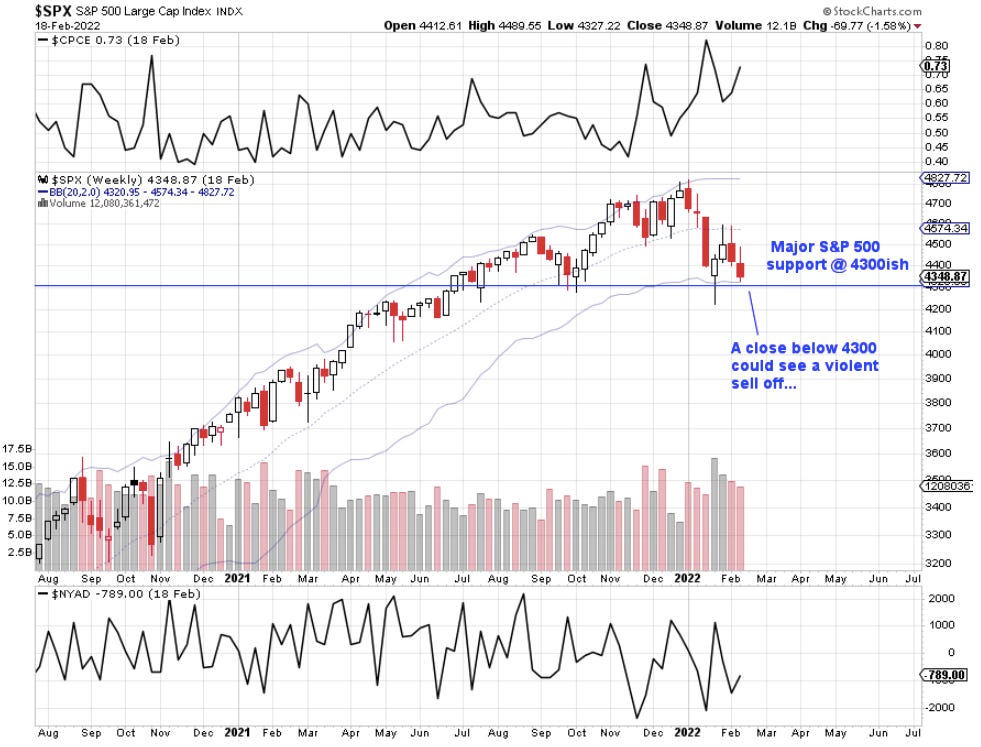
S&P 500 Approaching Major Support
In my newsletter article on Price Support, I noticed that 4,300 on the S&P has held as support since July of 2021:

This week, I am looking for a “test” of the 4,300 level, with a price bounce or collapse. One thing for certain is that the market will NOT let price gently bounce or collapse at 4,300… it will be VIOLENT.
S&P 500 Approaching Lower Bollinger: Signal 2
Here’s what else I’m looking at: price behavior at Bollinger bands. Price across all risk assets is approaching the lower Bollinger band on the daily and weekly charts…
Bollinger Offers High Probability Reversals
Recall from my piece about trading price peaks and valleys, Bollinger give us perspective on how far price has deviated from its historical mean:
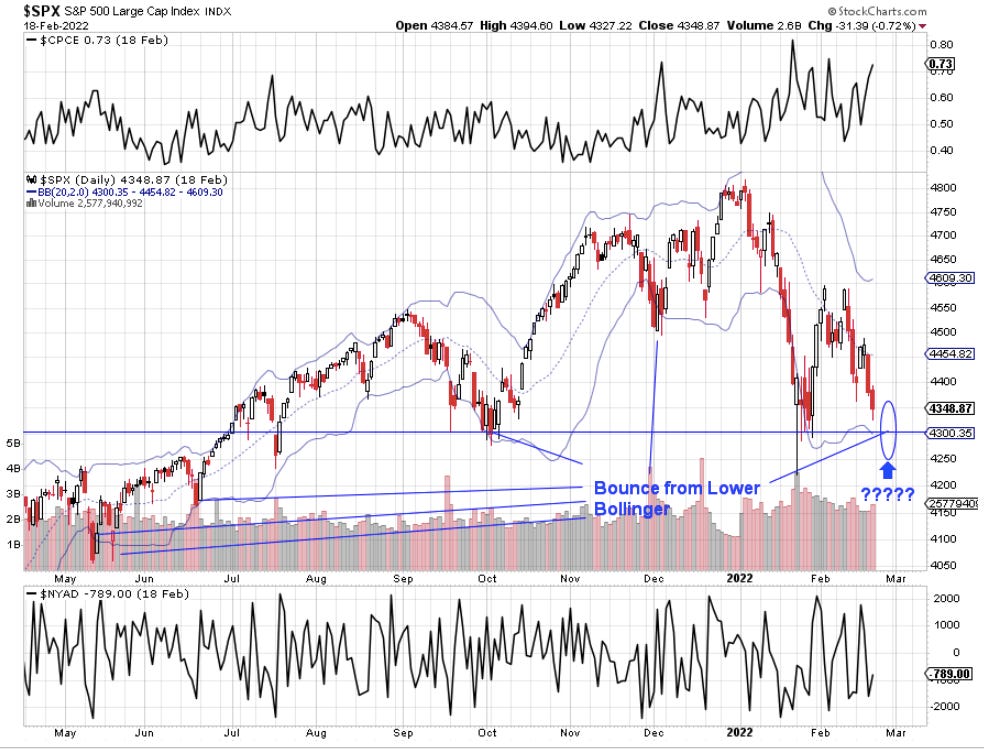
Notice price reverts back to its mean when it hits the lower Bollinger. Again, reversals at Bollinger are VIOLENT.
This week, I am looking for reversals at Bollinger.
Confirm Entry with Reversal Candlesticks
When you see price approaching multiple levels of support, you next need to look for candlestick reversal patterns. The three candlestick reversals I’ll be looking for include:
More on these later. But for now, trust their power. Also know that I am looking for reversals at price support of 4,300 (plus or minus), which just so happens to be around the lower Bollinger on the weekly and daily chart. This strengthens the price support of 4,300!
Conclusion: Expect Violent Price Action
Price will not passively cross 4,300, which happens to be support and also lower Bollinger on multiple timeframes. My prediction is that price will bounce extremely hard or collapse below support. The further price gets below 4,300, the more outside of lower Bollinger it will be, the more likely a reversal. Again, look for the reversal candlestick patterns above.
Also remember… the market is a future pricing mechanism. In a down market, it’s sell the rumor, buy the news. That means the market may sell off until we actually get the bad news out of Russia or from the Fed, at which point the market will do what is totally irrational: reverse and go up.
Happy Trading 😊