Stocks Prepare for Big Test: Bulls In Control?
Looks like a breakout is brewing in stocks; this is the only chart you need.
If you want to learn how to trade, you’re in the right spot. To all my new subscribers, thank you for joining.
My newsletters consist of sharing lessons we can learn about from live price action. I try to find real-life learning opportunities for my subscribers, every single week.
Right now is a great learning opportunity. Just take a look at the chart below:
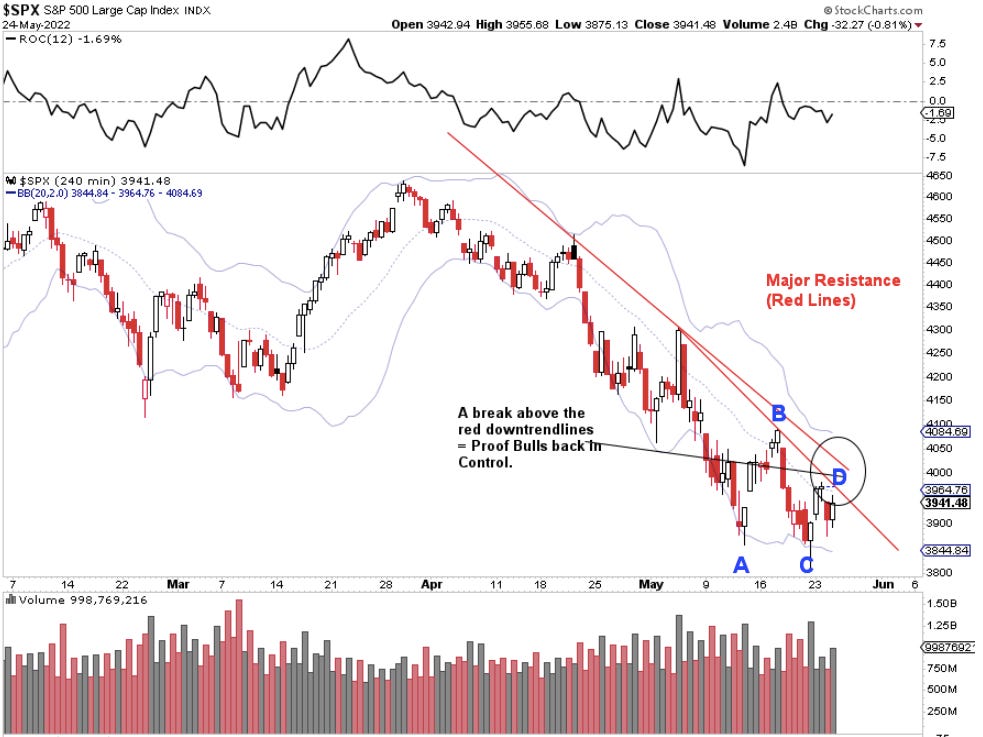
Price is about to test the (red) down trend lines, meaning, a close above the trend lines will confirm bulls are back in control. Trend line tests make for GREAT trading opportunities, because price tends to either (a) breakout, or (b) bounce back in the direction of the trend (in this case, down). Big price movements = great profit opportunities.
All eyes on Point D tomorrow, which is S&P 3,960-3,990. A close above this level and traders will take notice, and bears will “flip” to the other side. If price retreats from this level, buyers will step in hard.
To understand why, and what’s happening here, I’d like to go over each of the four parts, A-D.
If you’re new to trading, please take note.
At Point A, we saw an intraday reversal at the Lower Bollinger (price extreme). Remember, Bollinger represents price extremes. And when we see reversal candlesticks like a pin-bottom (intraday reversal), we should be ready for a quick up to the 20-day moving average. Point A was the first signal bears were running out of steam. Price bounced on this buy signal.
Point B - price hit the trendline, and sold-off. Many traders played this: Bulls bet on a breakout, and got clipped. Bears bet on a bounce off the line, and price plummeted.
Point C - the low, and retest of Point A. Also at the Lower Bollinger price extreme. This again signals bears are running out of steam. Aggressive traders purchased at Points A & C.
Now we are at Point D. This Price bounced off of the buy signal a C (buy/sell signal = candlestick @ Bollinger). Price is about to test the downtrend line from late April. Breakout above the downtrend line signal bears may be losing control. Conservative traders will wait for a breakout at Point D, and buy on any pullback.
The Stars are Lining Up for Bulls
The timing of this lines up perfectly with the fact that I believe inflation has peaked, if the bond market is any indication. This is bullish for stocks.
Not to mention, on the daily chart, we chalked up another intraday reversal (oftentimes forming what’s also known as a Hammer Candlestick). Again, bullish.
Intraday reversals in a bear market mean bears can’t keep bulls down, because bulls keep rallying back later in the trading day. If price goes down tomorrow, it will remain even more oversold, so you should expect many buyers to step in and create another intraday reversal.
Conclusion: Look for the Trendline to Break
In the next few trading sessions, bulls and bears will face off. It could be tomorrow, it could be through Friday.
Downside is limited however, and the stage is set for bulls to rip control away from the bears. Look for the trend ine to break.
A breakout and close above 396-399 tomorrow will confirm bulls are in control.
If there is a pullback after that, many buyers will step in.
Happy Trading 😊


