Stocks Just Broke Their Trading Range
Here's how to play it.
After the big run up two weeks ago, bears had little success holding down bulls. The market was simply trending sideways. Here’s what to look for next, or dive in below.
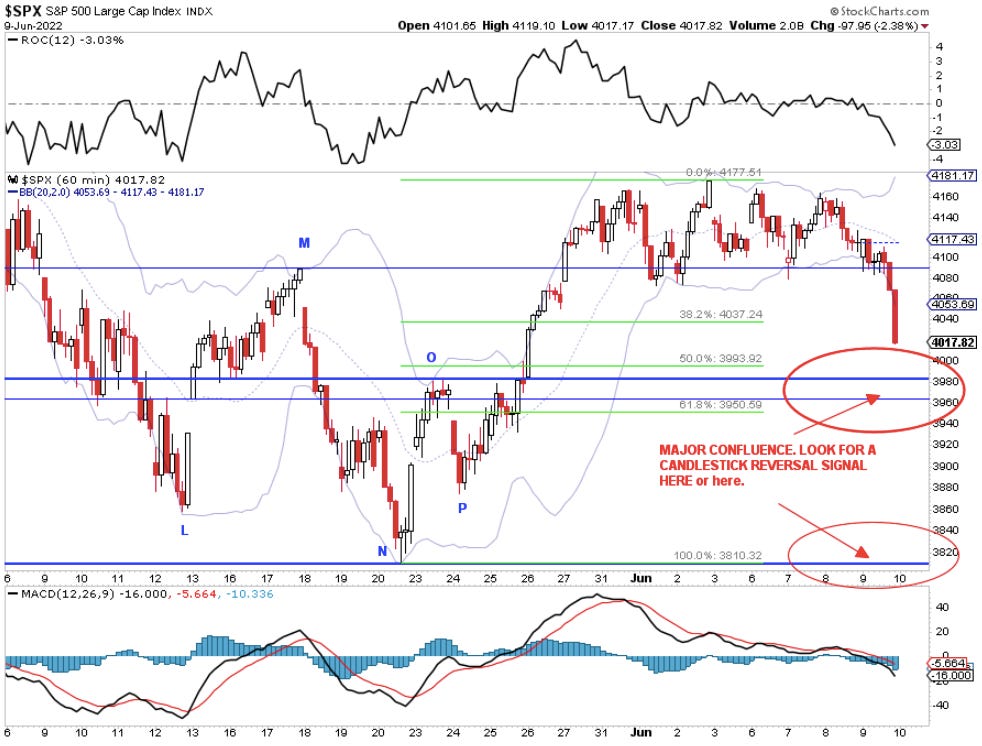
This is the picture from two days ago (S&P 500 1-hour)
Today, we saw the market breakdown below the lows. The market not only sold off, but when it officially broke below the lows, it cratered (relatively speaking).
S&P 500 (15-minute chart)
To successfully trade markets, you must come up with realistic eventualities - scenarios that could play where, if they do, you take action.
Field of Realistic Eventualities
Below are my four eventualities and how to play this breakdown.
Eventuality #1 - market posts a higher low, further confirming the uptrend the market is in.
Eventuality #2 - the market posts a double-bottom base for entry.
Eventuality #3 - the market gaps up tomorrow and never looks back
Eventuality #4 - the market posts a new low in the coming days.
Exactly What to Look For: Confluence
The definition of confluence is when things naturally merge together. In trading, confluence is when multiple support/resistance and technical levels coincide.
Confluence increases the probability of trading success because it highlights more points more traders are following.
Right now, price is approaching confluence:
Point O - prior resistance = future support
The gap below Point O usually holds as support.
Fibonacci from the low two weeks ago to the high last week.
Here is the chart with just the Fibonacci, at the 1-hour level:
Happy Trading 😊


