


Stocks Fail at Key Support Levels. Now What? 🤷♂️
Like every major move in stocks, now is a GREAT learning opportunity.

The candlestick signals triggered last week failed. Friday’s action pushed price into new technical territory. This should have bulls worried.
The flip side is, we’re seeing signs of a bottom with last weeks reversal candlesticks, including Monday’s hammer, and Thursday’s confirmation of the harami cross.
Friday negated these signals, but that doesn’t negate the fact that these signals still indicate a bottom is near.
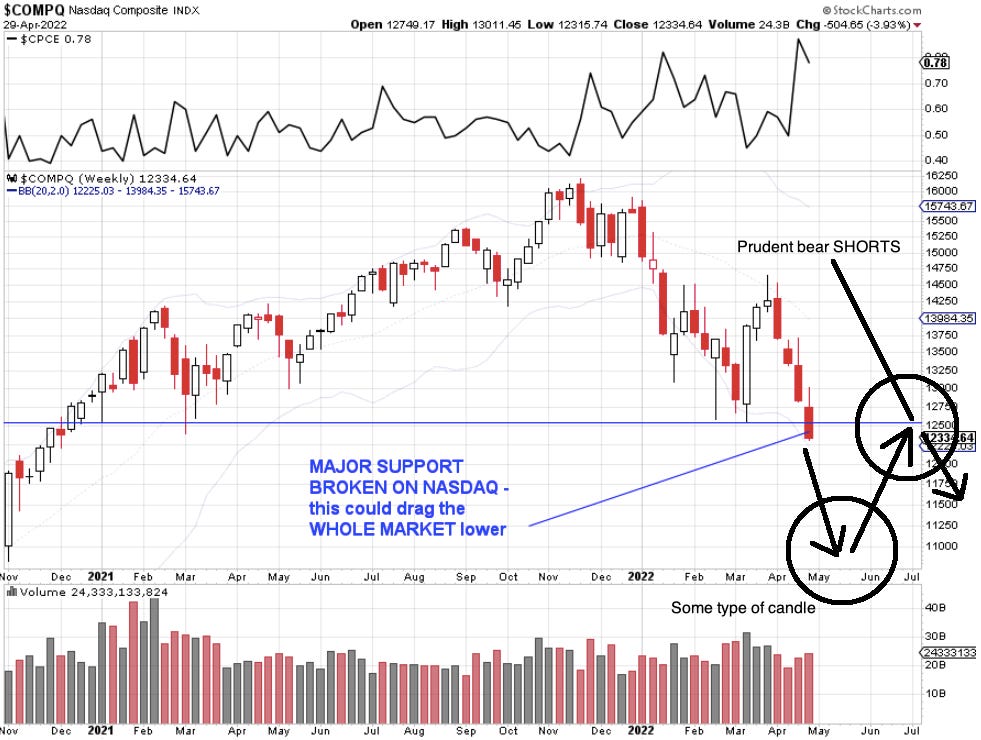
ESPECIALLY as this all happens at Bollinger.

Failed candlesticks signals like those from Monday and Thursday may not lead to higher prices, but still indicate the market is carving out a bottom.
We’re also seeing breadth weaken as the sell-off continues, which further indicates an interim bottom is near (see blue text in chart above).
Any bottom has to be coupled with good news to be sustainable.
Either way, it’s tradable.
Why bulls should be nervous right now.
The NASDAQ entered a new technical level, signaling a potential breakdown from here.

When price breaks below major support…
Bulls see a close below support as a sell signal.
Bears see it as an entry signal, meaning more selling.
This is why Monday/Tuesday could be VERY bloody.
However, the prudent bear won’t chase this bounce; instead, they wait until price falls, bounces back to this “support” level… and then indicates another reversal downward.
Prior support = future resistance.
This is a concept called polarity, coined by Steve Nison in his seminal book: Japanese Candlestick Charting Techniques.
This book is so powerful, trading friends and I won’t take a trade unless it fits Nison’s definition of a candlestick we see.
Remember, these signals originated in the 1700s rice markets of Japan. They have a long, reliable track record. They’re very powerful.
Why bulls may catch a break this week.
Not only is breadth weakening (see chart), but the $US Dollar Index formed a bearish engulfing with Fridays’ price action. The reversal pattern happened @ daily Bollinger, and price closed outside weekly Bollinger. This strengthens the signal of a weakening dollar to come. The monthly chart also signals a triple top on lower momentum. Further strengthening the potential move. The dollar is at a major turning point, and it looks good for bulls. Time will tell.
This personally makes me have a bias for an upside move, because everything is denominated in $USD*. And if everything is denominated in $USD, when $USD goes down, the price of everything goes up.
Any bounce this week could simply be because the dollar takes a short-term breather.
More good news. No new bad news.
The only reason GDP shrank last quarter (by 1.7%), is because of a widening trade deficit: imports far outweighed exports. Supply chain issues, which are alleviating every week, was the culprit.
Consumer spending, which is about 70% of total GDP, went up, meaning inflation hasn’t affected their spending habits yet.
And business spending on R&D and equipment increased nearly 10%, according to the WSJ.
Earnings have been a completely mixed bag, with any bad news manifesting analyst suspicions. The cat is out of the bag.
Not to mention, we just approved $22B in military spending for Ukraine. That goes toward GDP by way of paying companies like Lockheed-Martin. War, unfortunately, is good for the economy — that’s the way the capitalist system was designed.
The economy is strong — it’s just a matter of how softly the Fed can land.
And remember, a recession is too obvious at this point. If everyone is calling for it, it’s not going to happen. Plus, there’s a very powerful cycle at play here, and that is the mid-term elections.
Midterm Elections = Dems Lose (?) = Bull Run
If the Dems lose Congress in November, then DC will be in a stalemate. A stalemate means nothing gets done in DC, meaning no new regulations. No new regulations means the status quo exists for the next 2 years. That certainty of status quo brings serious bullishness: the Dow has averaged 48.2% in annual returns, from the mid-term year low to following year’s high. Real talk. Investors should be licking their chops at these lows.
The Week Ahead: Watch the Fed and Look for Candlesticks
The Fed, expected to raise rates 50bps.
The Fed is expected to raise interest rates 0.50% this week; anything less = good news. Anything worse than that = good news for market, because it’s been priced (remember, sell the rumor, buy the news).
Candlestick Reversals imminent.
Look for a hammer, bullish engulfing, or piercing pattern. I personally prefer these as there is virtually no visual ambiguity amongst traders who trade them.
More subjective, yet still powerful signals, include the harami cross or island bottom. I’m warming up to them, and I know the bearish versions of each are more reliable in bull markets (vs. the bullish counterparts in bear markets).
Authors Note on Candlesticks: More Insights
Candlesticks can become unreliable at major pivots, but still signal a bottom is near. That is why you must confirm candlestick opportunities on every time frame, all the way up.
The trend is your friend until the dead end when it ends. -Me
If you trade the 1-hr and 4-hr charts, then at the close of that session, check out the daily and weekly charts.
Are the daily and weekly charts confirming your 1 hour candlestick signal? Or, is the hourly chart confirming your 15 minute signal? If you’re going against the major trend, then trade the much lower time frames (i.e. 15 minute). But, if a 15 min. candlestick reversal is in the direction of the larger trend, you can trade more aggressively.
I’ll say it again - if you’re bucking the trend, get out once a profitable trade materializes. If you’re with the trend, ride the wave and/or invest more aggressively.
Use your intuition as well as smarts — whole brain thinking.
An Endless Ocean of Opportunity
As a trader, I know the next signal is right around the corner, like an abundant ocean of opportunities, every wave in it the potential for profit. I use Bollinger / Candles as my guiding light. With profits, I invest in stocks.
As an investor, I am concerned that the market is technically breaking down, and needs really good news for any sustained rally. I love investing at this level and as it goes lower, I will buy more only with technicals confirmed by great news. If things get low enough from here, I’ll average down again.
Conclusion: What a great opportunity.
When I first started trading in 2008, I missed a trade I didn’t have the balls to enter. It turned out to be very profitable. I was excitedly complaining to my dad, because I was right but missed the trade. My dad said to me, “Who cares? New opportunity is endless in the stock market”. He was so right.
I trade both as a bull and bear. My go to is very short-term options trades with the potential to 5-6X. Minimal downside with huge upside. My profits get invested into stocks. This makes my profits permanent.
Other than owning stock for the long-term, I have no skin in the game on which way this market goes (i.e. I’ll trade it either way).
Profits go into high-yielding LPs, Investor Business Daily (“IBD”) top rated stocks, growth stocks with strong balance sheets, and household names like Ford.
If the market keeps going lower, I just get more excited for the opportunity that it creates.
TL:DR
Watch the Fed this week, as they might surprise the market.
Look for a candlestick reversal on S&P, Dow and Nasdaq.
Forward this to a friend you think would find this information useful.
Happy Trading 😊
*For now, at least (i.e. Bitcoin).