Stocks are down, but so is fear. Read this.
The market is overly bearish, and it's signaling good news to come.
You’ve heard it before: buy when others are fearful, and sell when others are greedy.
What’s happening in the market right now is a good example.
We’re seeing fear peak…
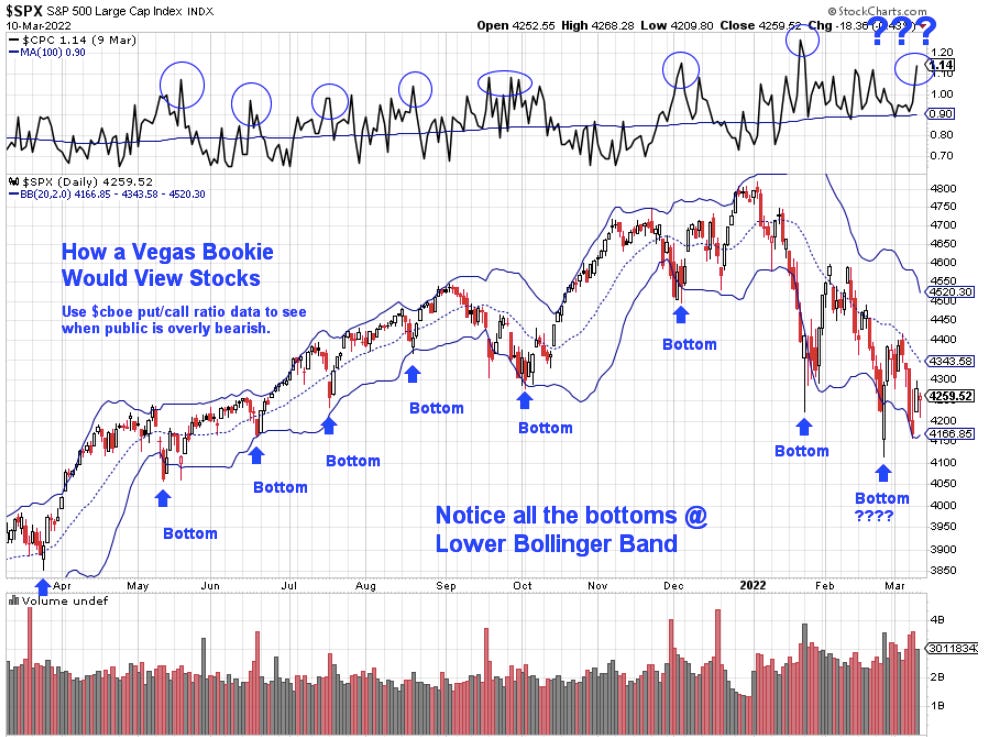
We’re seeing an overly bearish options market.
And we’re still seeing a technical long set-up.
This is, on the surface, very bullish. And that is very contrarian.
Let’s dive in.
P.S., at the end of this post, I explain how you can recreate my charts for free on StockCharts.com.
Today’s Recap: Intraday Reversal
Today, we saw a pretty decent intraday reversal, which often sends price in the other direction. In this case, that would be up.
Peak Fear = Stocks Bottom
As I often mention, you want to buy when fear peaks. Timing peak fear is harder than seeing peak fear, but once it’s happened, it’s easy to see.
Stockcharts.com ticker $VIX
Overly Bearish Market = Time to Get Bullish
Remember, bookies in Vegas set the line by countering the public bets. The almost exact same thing happens in the stock market, through a side-market called the options market.
Algorithmic traders are constantly balancing bullish and bearish bets in the options market.
The options market gives us a feel about how people are thinking about price for a stock in the future.
By looking at the bearish bets (puts) vs. bullish bets (calls), we can get a feel for if the market is overly bearish or bullish.
When the options market gets overly bearish and fearful, meaning a high put/call ratio, it’s usually a good time to buy stocks.
Yesterday, the overall put/call ratio for the CBOE rocketet, even though stocks were up. Stocks went up, and fear skyrocketed as well.
Stockcharts.com ticker $SPX
We can see the “come down” in fear today. Open up CNBC.com and you’ll notice that stocks AND the Vix (the “Fear Index”), were down today…
Technically, the Market is Set to Bounce Hard
We are trading at the lower Bollinger Band of price on the weekly chart. This means the likelihood of a reversal to the average is likely.
Stockcharts.com ticker $VIX
Sustainable rallies need good news.
Given the technical breakdown in the market, the market needs good news to sustain any rally. It can technically bounce, but any sustained move must have good news attached to it.
Often times, technicals predict the news.
Final Thoughts: Anticipate Good News
The market is vulnerable right now. Any bad news and we’ll see capitulation. Any good news, and we’ll see a monster rally.
Technicals, sentiment, and the collapse in fear all signal higher prices, and soon. That means anticipate good news — and hopefully it’s an end to the destruction in Ukraine, which is dragging on hearts, minds, and markets.
Setting up StockCharts.com (FREE)
Go to stockcharts.com
Enter in $SPX for the S&P 500.
Scroll to below the chart, the section called Overlays.
You will see two Simple Moving Averages.
Choose Bollinger Bands for one of them.
Choose “None” for the other one.
Below that you will see an Indicators section.
Where it says RSI, choose “Price” and then enter $CPC next to it, instead of the default $SPX. This gives you the overall CBOE put/call ratio.
Where you see MACD, choose “none”
Scroll to just below the chart, you will see Volume with a dropdown next to it that says “Overlay”. Click “Separate” instead.
Click any Update button.
Now you can see what I see.
Happy Trading 😊


