
$NVDA more likely down than up. But if up, then down. Expect volatility.
It's trading outside the Upper BB on the 6 month candle chart. Very bearish.

NVDA 0.00%↑ earnings are today. And given recent headwinds*, a mean reversion is due.
I think it’s more likely to go down, than up.
It might not happen tomorrow, or this week.
But if we go up, it’s going right back down.
Why?
Because it’s currently trading outside the Upper Bollinger Band on the 6-month candle chart.
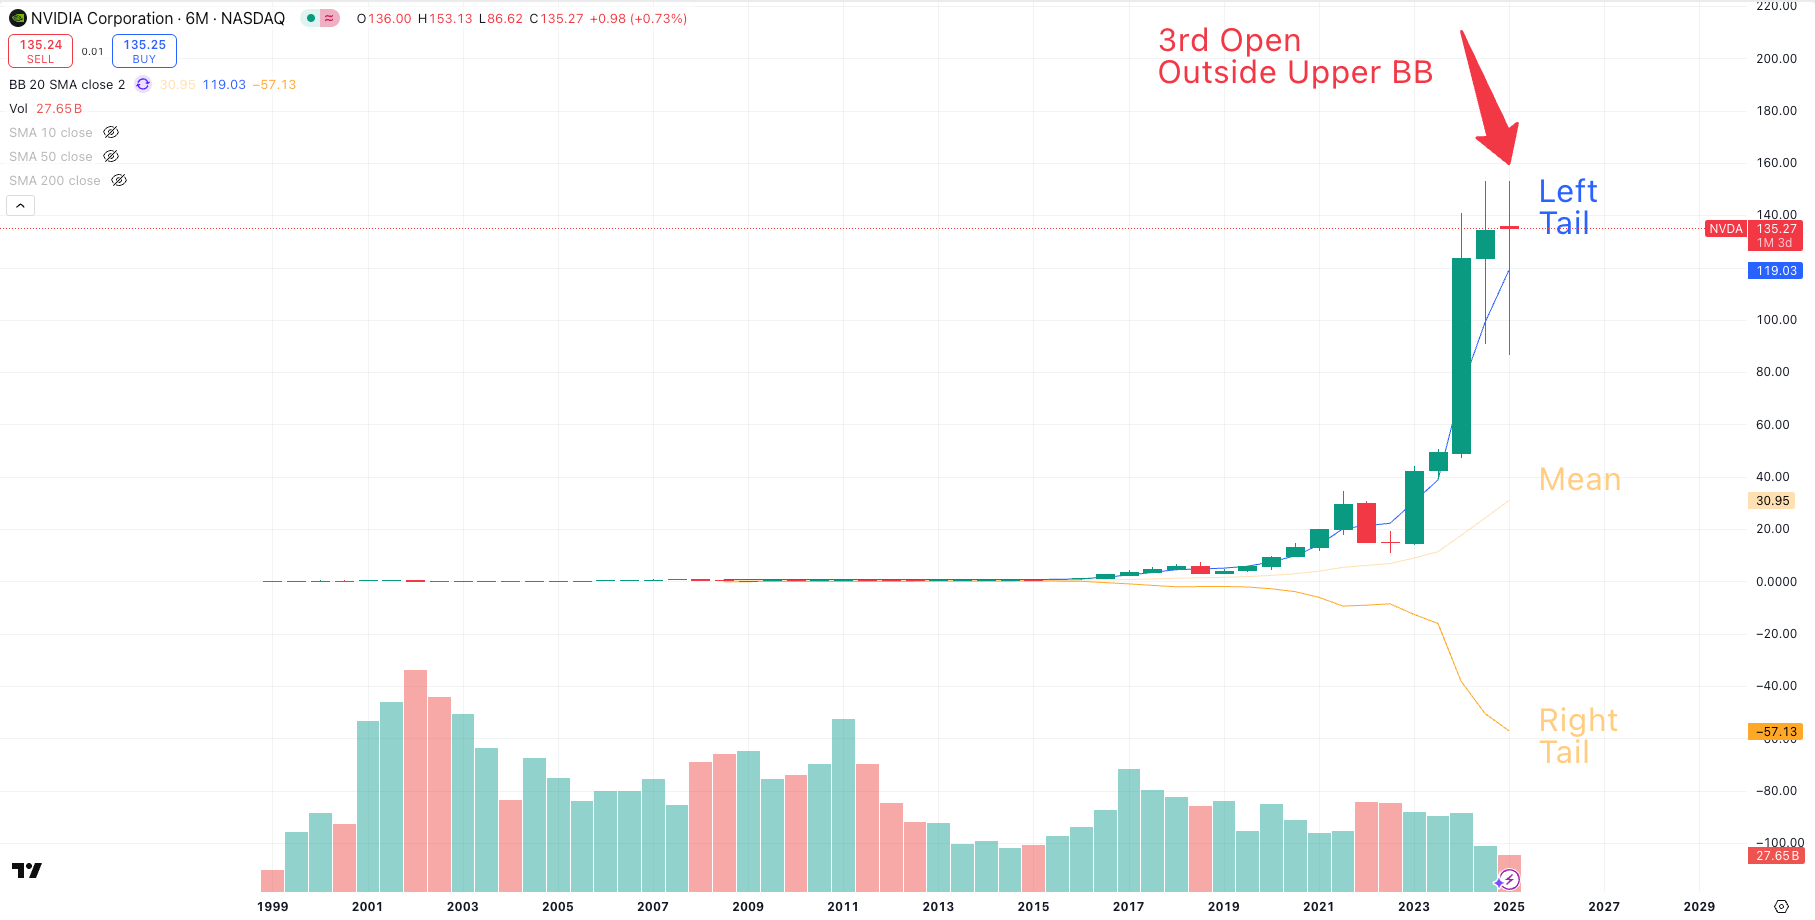
A quick primer on Bollinger Bands
Bollinger Bands represent a range for price distribution i.e. The Bell Curve
The Upper Bollinger Band is 2 standard deviations above the mean (average).
The Lower Bollinger Band is 2 standard deviations below the mean (average).
And the mean (or average) is the 20 period simple moving average.
If you look at NVDA 0.00%↑ on the 3-month chart, it’s trading at the Upper Bollinger band. Meaning it’s at a price extreme on the larger time frames.
And the longer the time frame the stronger the signal.
NVDA is due for an 11% implied move today after market - if it rockets, I will just add to my Put LEAPs for next year.
Because with the fundamental headwinds, it’s way more likely we revert to the mean, than push further into the left tail.
Happy Trading
*Fundamental headwinds - which I believe are almost always reflected in price - include: Deepseek chips making NVDA irrelevant, export controls on the H20 chips to China, decelerating earnings growth (which is a sell signal for institutions). Yes, NVDA is expected to post mid double digit growth in sales, but that’s a significant deceleration from 200%+ in prior reports. Slowed growth = sell signal for the biggest buyers.