
Major Buy Signal on JP Morgan
Price is trading in the tails of the bell curve. Watch for a hard bounce.

Hi stock market friends. Quick intraday post here.
As I type this, there is a major buy signal brewing on JP Morgan ($JPM):
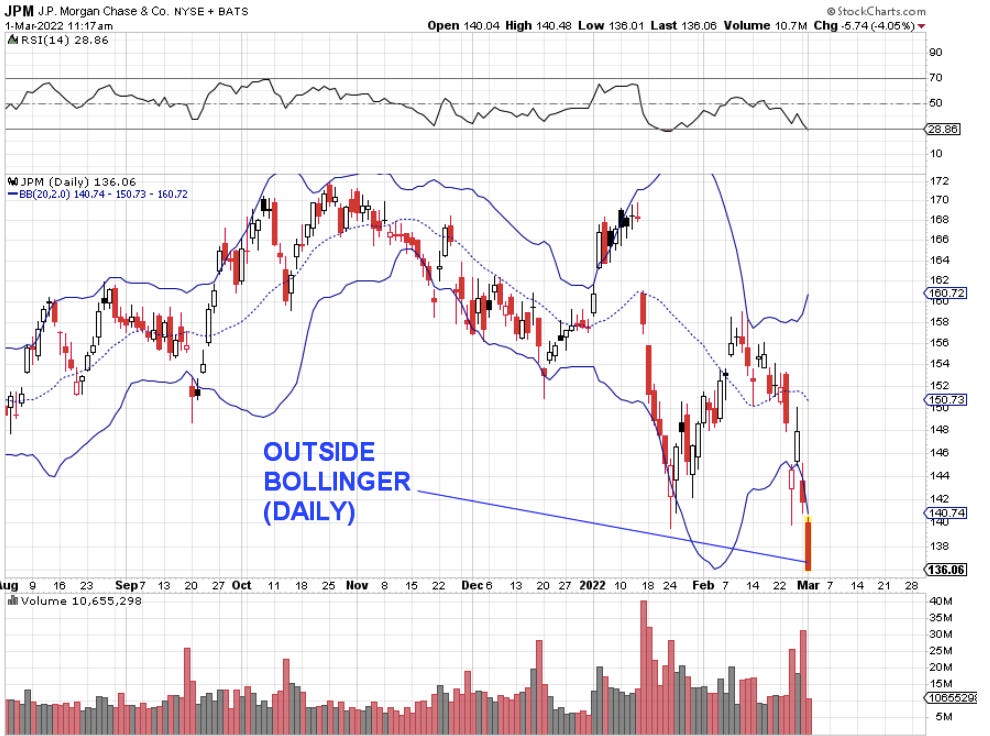
Price is currently trading outside of Bollinger bands on the 4 hour, daily and weekly charts.
This means the likelihood that price “Reverts” back to the mean is very, very high.
In this case, that would be a move up.
What This Means for JPM Stock:
Recall that Bollinger Bands (the blue lines above and below price) represent +/- 2 standard deviations from the historical average. Price is trading in the “tails” of the statistical bell curve. Remember stats from high school?
The likelihood price stalls, finds a floor, and reverses UP to the historical average is super high.
The mean (average) is the dashed blue line in the center of the charts below.
The blue lines above and below price represent +/- 2 standard deviations from the mean.
Remember, 87% of all price movement occurs within the blue Bollinger bands, so when we see price outside, you should be looking for a reversal.
JPM Price on 4 hour

JPM Price on Daily
JPM Price on Weekly

Final Thoughts on a JPM Bounce
Watch this one closely. Buying now is aggressive; waiting for an intraday or intraweek reversal will give you confirmation.
Outside of any catastrophic news, price will likely see a very nice bounce.