
Is This Energy Bull Market Over?
If the monthly charts are any indication, it's a resounding yes.

We’ve seen major candlestick reversals on the monthly charts of energy stocks and ETFs.
Here is a quick look at WTIC Crude Oil, XLE 0.00%↑ energy ETF; giant oil leader Exxon Mobil (XOM 0.00%↑); IBD growth leader Earthstone Energy (ESTE 0.00%↑); and UNG 0.00%↑, the natural gas ETF, which also saw a significant reversal.
Each energy issue has exhibited bearish engulfing candlesticks or piercing pattern reversals.
These are VERY BEARISH SIGNALS in energy.
Looks like this energy bull market is over, for now at least.
$WTIC, Monthly: piercing pattern; did not break to new highs. The sell off occurred on higher than previous two month volume.

XLE 0.00%↑, Monthly: bearish engulfing.

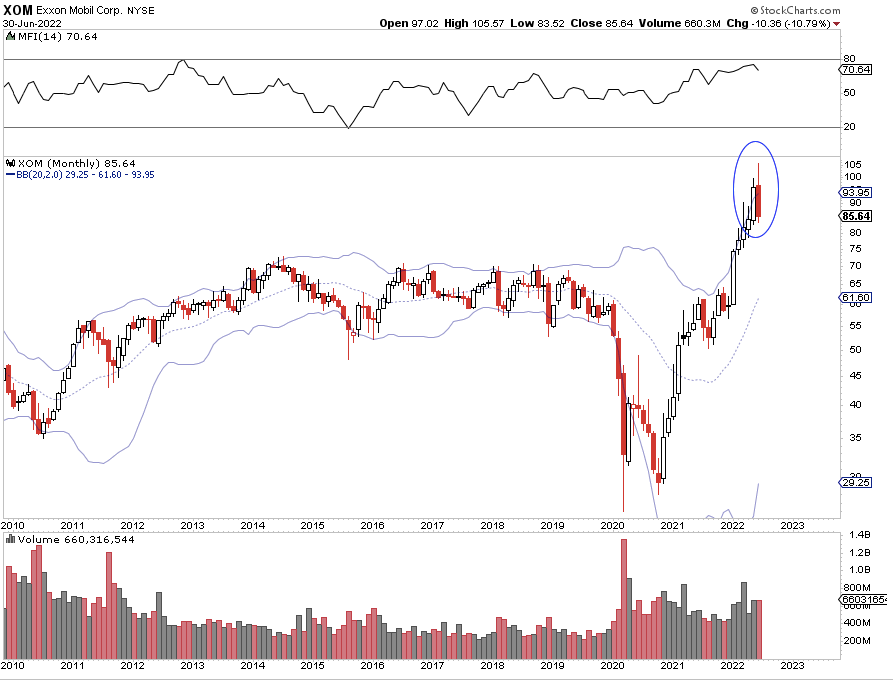
XOM 0.00%↑, Monthly: dramatic intra-month reversal that formed a piercing pattern.
ESTE 0.00%↑, Monthly: same as XOM, a dramatic intra-month that formed a piercing. The volume on the ESTE sell off last month was insane.

UNG 0.00%↑, Monthly: bearish engulfing.

How You Can Trade This
The new trend appears to be down, though it’s still early. This is likely on worries of an economic slowdown. Ultimately, lower energy prices are good for stocks.
Here’s what I’m doing: